
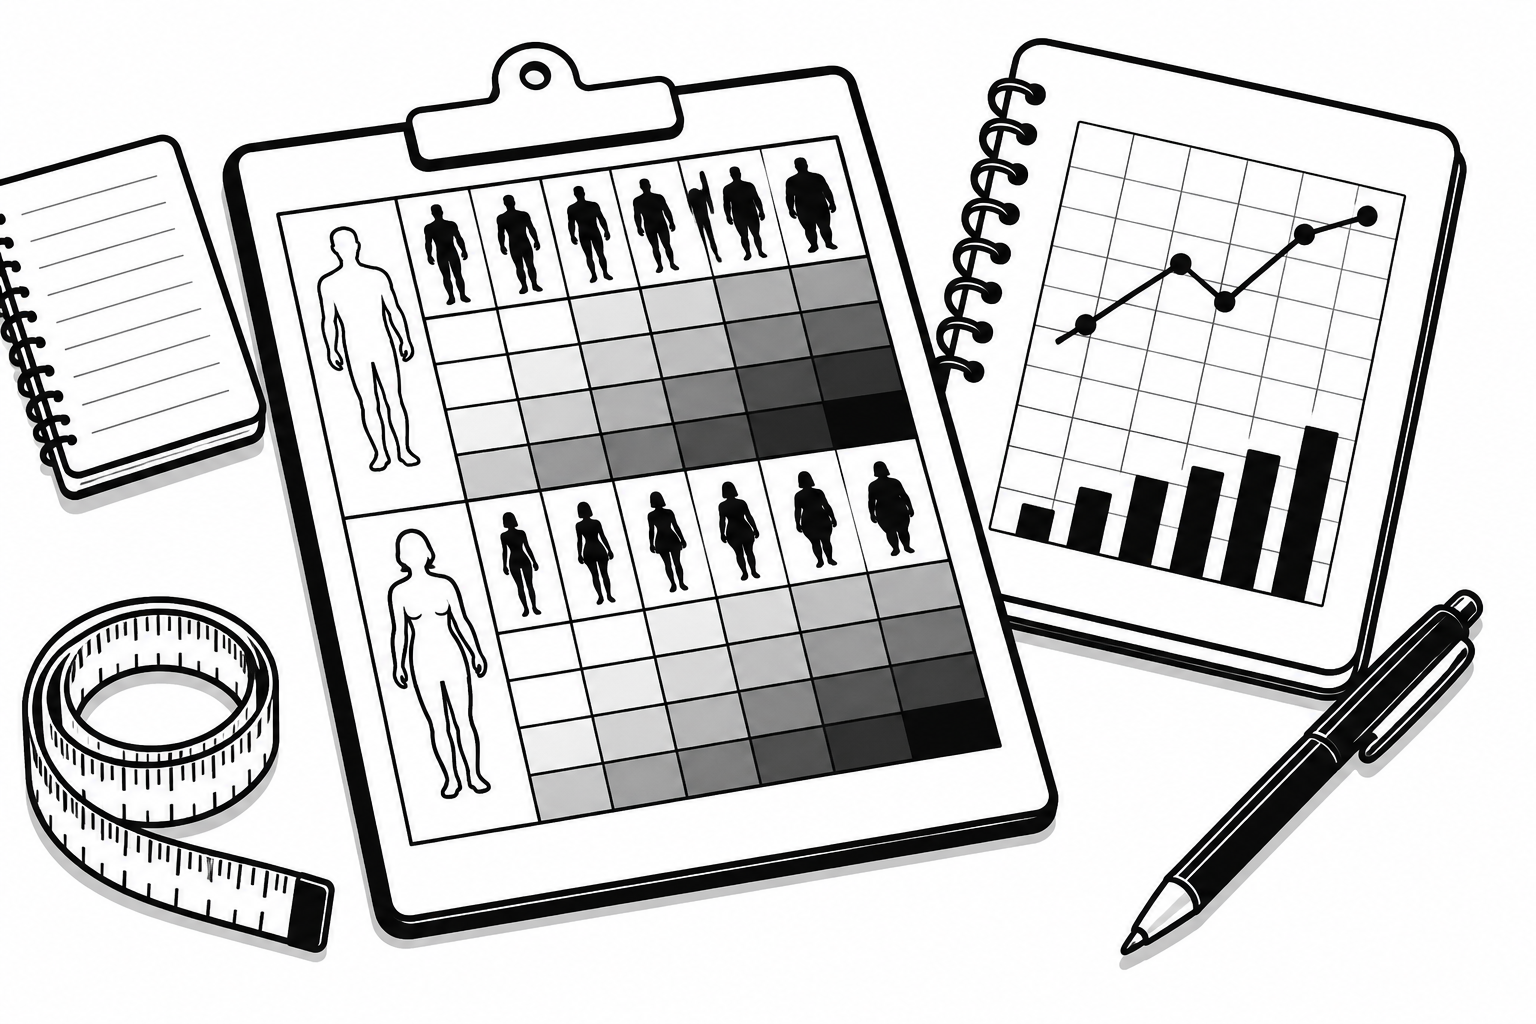
A body fat percentage chart can make it easier to understand where an estimated body-fat result falls within broad reference ranges. Unlike body weight, body-fat percentage provides information about how much of your total weight is fat.
However, a chart should not be treated as a universal definition of healthy body composition. Reference ranges vary by sex, age, population, and measurement method. The most useful way to read a chart is to understand what the categories mean, identify the method behind the numbers, and consider the result alongside other information about your health and fitness.
What Is a Body Fat Percentage Chart?
A body fat percentage chart is a reference table that organizes estimated body-fat percentages into broad categories.
A typical chart may separate results into categories such as:
- Essential fat
- Athletic
- Fitness
- Average
- Higher body fat
A chart is therefore best used as a reference rather than a pass-or-fail test.
How to Read a Body Fat Chart
Start by identifying three things:
- Your estimated body-fat percentage
- Your sex
- The reference population used by the chart
Then find the range containing your result.
For example, if a chart lists 18–24% as a broad average range for adult men and your estimated result is 21%, your result falls within that reference range.
Body Fat Percentage Ranges
There is no single chart that applies perfectly to everyone.
One commonly cited general reference uses the following broad categories:
| Men | General description | Women | General description |
|---|---|---|---|
| 2–5% | Essential fat | 10–13% | Essential fat |
| 6–13% | Athletes | 14–20% | Athletes |
| 14–17% | Fitness | 21–24% | Fitness |
| 18–24% | Average | 25–31% | Average |
| 25%+ | Higher body fat | 32%+ | Higher body fat |
These values are broad reference categories rather than universal medical cutoffs.
Very low body-fat levels are not automatically healthier, and higher body-fat levels can be associated with increased health risks. Interpretation should consider the individual and the method used to obtain the estimate.
Body Fat Charts for Men
Men generally have lower essential body-fat requirements than women.
A body fat chart for men may therefore show lower reference ranges for essential, athletic, and fitness categories.
For example, a male result around 10% would usually fall into a very lean category on many commonly used charts, while a result around 20% may fall within a broader average reference range.
Body Fat Charts for Women
Women generally have higher essential body-fat requirements than men.
A body fat chart for women therefore uses higher reference ranges.
For example, a result around 18% may fall within an athletic or very lean reference category on some charts, while a result around 28% may fall within a broader average range.
Age and Body Fat Percentage
Body composition commonly changes with age.
Muscle mass may decrease and fat mass may increase as people get older, especially when physical activity and resistance training decline.
For this reason, an age-specific reference may provide different context from a chart designed for all adults.
Body Fat Categories
Body-fat categories are labels used to organize ranges of estimated body-fat percentages.
Common labels include:
Essential fat: The minimum level needed for normal physiological function.
Athletes: A relatively lean range often associated with people participating in organized sports or intensive training.
Fitness: A lean range commonly associated with physically active adults.
Average: A broad reference range for the general population.
Higher body fat: A range above the reference levels shown on a particular chart.
These categories can make a chart easier to understand, but the labels are not diagnoses.
Body Fat Percentage vs BMI
BMI and body-fat percentage are different measurements.
BMI uses height and weight:
BMI = weight in kilograms ÷ height in meters²
Body-fat percentage estimates the proportion of total body weight that is fat.
BMI cannot distinguish muscle from fat. A muscular person may therefore have a higher BMI while having a relatively moderate body-fat percentage.
The BMI Calculator can provide a general screening measure, while the Body Fat Calculator provides an estimate of body composition.
Body Fat Index Explained
The phrase body fat index chart is sometimes used online to describe a reference table of body-fat percentages.
However, "body fat index" is not always a standardized measurement with one universally accepted formula.
Some websites use the term simply as another way of describing body-fat percentage. Others may use their own scoring system.
Body Fat Ratio Explained
The term body fat ratio chart can also be confusing.
Body-fat percentage is the proportion of body weight that is fat. A ratio may be presented differently depending on the source.
For example, a body-fat percentage of 25% means approximately 25 parts of total body weight out of 100 are fat.
What Body Fat Percentiles Mean
A body fat percentile chart describes how a measurement compares with a reference population.
For example, being at the 75th percentile would mean the measured value is higher than approximately 75% of the reference group, depending on how the percentile was constructed.
Why Charts Differ Between Sources
It is normal to find different body-fat charts online.
Differences can result from:
- Different research populations
- Different age groups
- Different definitions
- Different measurement methods
- Different statistical approaches
- Different purposes for the chart
An athletic organization may use one set of categories, while a health reference may use another.
How Measurement Methods Affect Results
A body-fat percentage is an estimate unless it is measured using a highly specialized method, and even advanced methods have measurement uncertainty.
Common methods include:
- Skinfold measurements
- Bioelectrical impedance
- Circumference-based equations
- DEXA
- Air displacement methods
The Body Fat Calculator can provide a convenient estimate, but the result should be interpreted according to the method behind the calculator.
Why Body Fat Charts Are Estimates
A chart provides a framework for interpreting a measurement or calculation.
Your estimated percentage can change because of:
- Hydration
- Recent exercise
- Food and fluid intake
- Time of day
- Measurement technique
- Device differences
- Formula differences
How to Interpret Your Body Fat Result
When you receive a body-fat result, avoid focusing only on the category.
Instead, ask:
- Which method produced the result?
- Was the measurement taken consistently?
- Does the chart match my age and sex?
- Is the result changing over time?
- What does my waist measurement show?
- How does my fitness compare with previous measurements?
- Are there other health factors that matter?
Using a Body Fat Chart With Other Measurements
A body-fat chart works best as one part of a broader assessment.
You can consider it alongside:
- Body weight
- Waist circumference
- BMI
- Physical fitness
- Strength
- Activity level
- Nutrition
- Health history
The Ideal Weight Calculator can provide another reference estimate based on height and other measurements.
Summary
A body fat percentage chart helps organize estimated body-fat results into broad reference categories. Men and women generally use different ranges because normal body composition differs between the sexes.
Terms such as body fat index chart, body fat percentile chart, and body fat ratio chart can refer to different types of reference systems, so always check the definition and methodology behind a chart.
Age, measurement method, hydration, muscle mass, and other factors can influence body-fat results. Different charts can therefore show different categories for the same percentage.
For a practical estimate, use the Body Fat Calculator and interpret the result alongside BMI, waist circumference, fitness, and other relevant health information. The BMI Calculator and Ideal Weight Calculator can provide additional context.
The goal is not simply to reach the lowest possible body-fat number. The goal is to understand your measurement accurately and use it as one piece of a broader picture of health and body composition.
References
Gallagher, D., Heymsfield, S. B., Heo, M., Jebb, S. A., Murgatroyd, P. R., & Sakamoto, Y. (2000). Healthy percentage body fat ranges: An approach for developing guidelines based on body mass index. The American Journal of Clinical Nutrition, 72(3), 694–701. https://doi.org/10.1093/ajcn/72.3.694
National Heart, Lung, and Blood Institute. (2022). Overweight and obesity: Symptoms and diagnosis. National Institutes of Health. https://www.nhlbi.nih.gov/health/overweight-and-obesity/symptoms
National Institute of Diabetes and Digestive and Kidney Diseases. (n.d.). Am I at a healthy weight? National Institutes of Health. https://www.niddk.nih.gov/health-information/weight-management/adult-overweight-obesity/am-i-healthy-weight
Kyle, U. G., Bosaeus, I., De Lorenzo, A. D., et al. (2004). Bioelectrical impedance analysis—Part I: Review of principles and methods. Clinical Nutrition, 23(5), 1226–1243. https://doi.org/10.1016/j.clnu.2004.06.004
Heymsfield, S. B., Lohman, T., Wang, Z., & Going, S. (Eds.). (2005). Human body composition (2nd ed.). Human Kinetics.